Criminal Justice Infographics - Davinia Brito
Infographics In Criminal Justice
| Infographics are important to consider in Criminal Justice because they help interpret complex criminal data, which can be difficult for readers to understand. Infographics in Criminal Justice create visual formats that assist in presenting crime statistics and analysis, as well as investigative reports. Infographics in Criminal Justice use charts, graphs, and maps to help departments like law enforcement and criminal justice agencies. These charts, graphs, and maps help identify crime trends and patterns, add to investigations, and explain complex topics to the public |
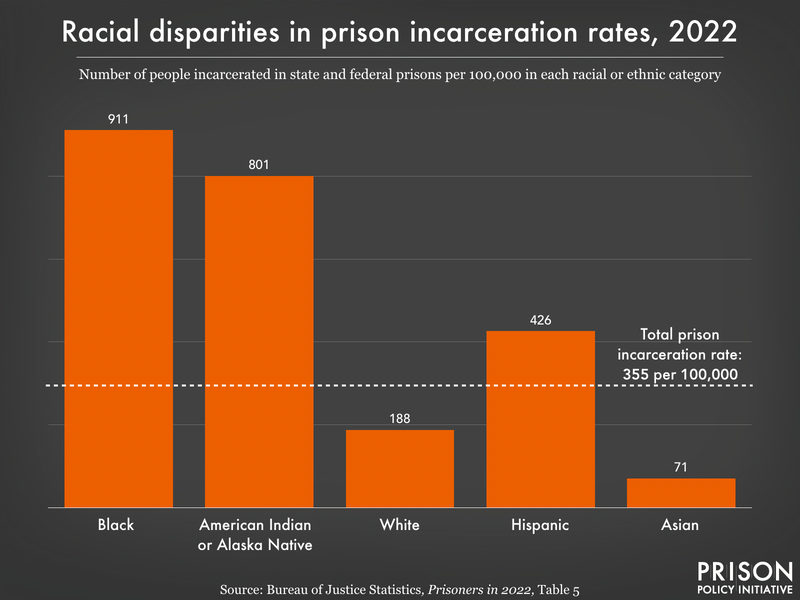 | ||
This graph demonstrates Racial Disparities in Incarceration since 2020. Reports from the Bureau of Justice Statistics have claimed an increase in racial and ethnic categories in jail populations, along with gender populations. This chart demonstrates that Black people are six times the rate of white people and more than twice the rate in every single state.
References Wang, L. (n.d.). Updated charts show the magnitude of prison and jail racial disparities, pretrial populations, correctional control, and more. Prison Policy Initiative. https://www.prisonpolicy.org/blog/2024/04/01/updated-charts/ |


No comments:
Post a Comment